Scheduling in SAP Lumira Discovery
This blog summarizes the concept of “Conditional Formatting in SAP Lumira Discovery”. This is high level document assumes resource has basic knowledge of SAP Lumira concepts.
Read More
This blog summarizes the concept of “Conditional Formatting in SAP Lumira Discovery”. This is high level document assumes resource has basic knowledge of SAP Lumira concepts.
Read More
This blog summarizes the concept of “Scheduling and features provided by SAP for Scheduling Lumira functionalities”. This is high level document assumes resource has basic knowledge of SAP Lumira concepts.
Read More
This document covers the concept of “Filtering in SAP Lumira Discovery”. This is high level document assumes resource has basic knowledge of SAP Lumira Discovery concepts.
Read More
This document is written to give an overview of the BI tool “SAP Lumira Discovery”.SAP Lumira Discovery is the on-premise Self-Service BI tool which enables data discovery,
Read More
This document covers the concept of “Calculated Measures and Dimensions” in SAP Lumira Discovery. This is high level document assumes resource has basic knowledge of SAP Lumira Discovery concepts.
Read More
This document covers the concept of “Calculations and Functions to Enhance Data” in SAP Lumira Discovery.This is high level document assumes resource has basic knowledge of SAP Lumira Discovery concepts.
Read More
This document covers the SAP 4.2 features. This is high level document assumes resource has basic knowledge of SAP BO Concepts.
Read More
BI Commentary is a new feature introduced in the Product Version BI 4.2. It allows users to collaborate by commenting on any of the data/statistics
Read More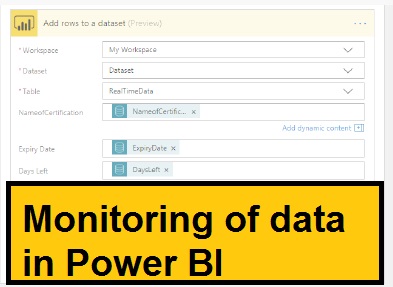
This document covers the concept of “Monitoring of data” in Power BI. This is high level document assumes resource has basic knowledge of Power BI Concepts.
Read More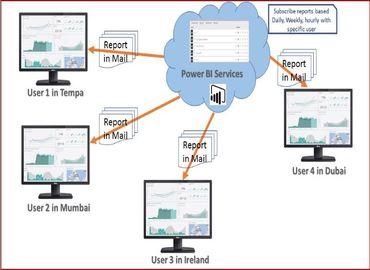
This document covers the concept of “Scheduling” in Power BI services. This is high level document assumes resource has basic knowledge of Power BI Concepts.
Read More
This document teaches us the concept of “Hyperlinks” in Power BI. This is high level document and assumes that resource has basic knowledge of Power BI.
Read More
What is the difference between report and dashboard- This question is one of the main question that people have when they start looking into Power BI.
Read More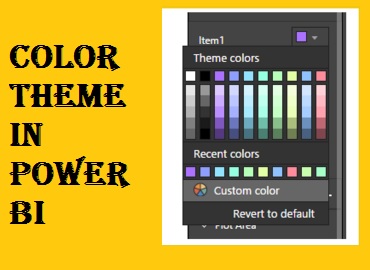
This document covers the concept of “Color Theme” in Power BI. This is high level document assumes resource has basic knowledge of Power BI Concepts.
Read More
Row-level security is just a way to restrict data access by users by applying security on data row level. At row level, filters restrict data which can be define within roles.
Read More
This document covers the concept of “Relationship View” in Power BI. This is high level document and assumes that resource has basic knowledge of Power BI.
Read More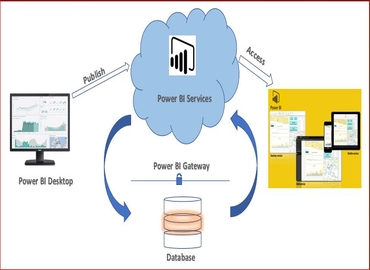
Gateway is an application that creates the link between Power BI cloud-based services and the datasource/
Read More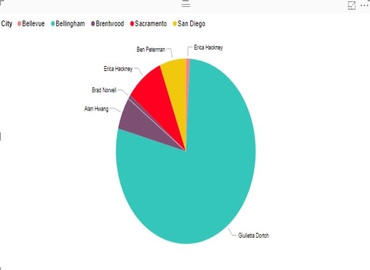
A pie chart is a special type of chart in which wedge- like sectors are used to illustrate relative sizes of data.In this chart, each wedge represents
Read More
This document covers the concept of “How to create mobile optimize report in Power BI desktop and view in Power BI App”.
Read MoreCopyright ©2022 Hybrid BI Solutions Ltd. All Rights Reserved