Slicers and Sync Slicers in Power BI
This document covers the concept of Slicer. We will learn about Sync Slicers, steps to apply Sync slicers and how visuals interact in Power BI Desktop
Read More
This document covers the concept of Slicer. We will learn about Sync Slicers, steps to apply Sync slicers and how visuals interact in Power BI Desktop
Read More
This document covers how to dynamically change objects in different visualization in Power BI
Read More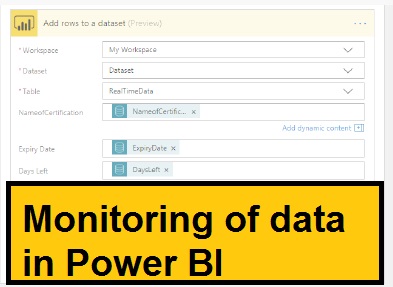
This document covers the concept of “Monitoring of data” in Power BI. This is high level document assumes resource has basic knowledge of Power BI Concepts.
Read More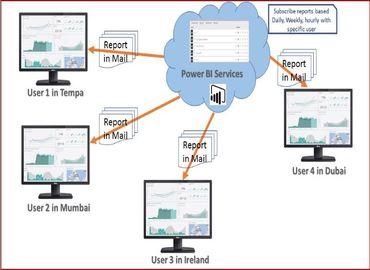
This document covers the concept of “Scheduling” in Power BI services.
Read More
This Document highlights the differences between Dashboards and Reports in Power BI
Read More
This document covers the concept of “Color Theme” in Power BI. This is high level document assumes resource has basic knowledge of Power BI Concepts.
Read More
Row-level security is just a way to restrict data access by users by applying security on data row level. At row level, filters restrict data which can be define within roles.
Read More
This document covers the concept of “Relationship View” in Power BI. This is high level document and assumes that resource has basic knowledge of Power BI Concepts.
Read More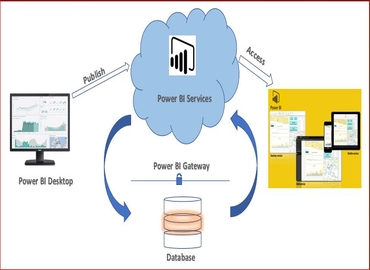
Gateway is an application that creates the link between Power BI cloud-based services and the datasource/database located on-premises.
Read More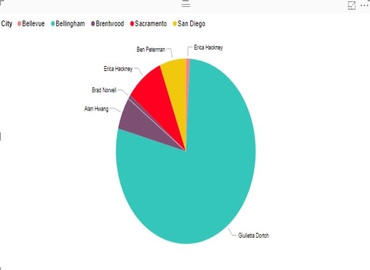
A pie chart is a special type of chart in which wedge- like sectors are used to illustrate relative sizes of data.
Read More
This document covers the concept of “How to create mobile optimize report in Power BI desktop and view in Power BI App”.
Read More
This document covers the concept of “Getting Data from Excel sheets” in Power BI services.
Read More
This document covers the concept of “Difference between Calculated Columns and Measures” in Power BI.
Read More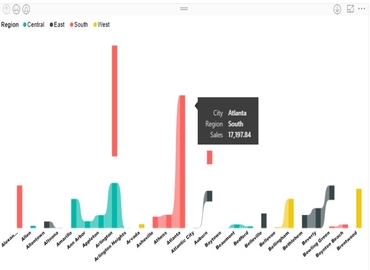
Ribbon chart is used to represent data and easily determine which data category has the highest rank (largest value).
Read More
This document covers the concept of “Drillthrough Filters” in Power BI Desktop. This is high level document created and assumes that resource has basic knowledge of Power BI Concepts.
Read More
Power BI supports connectivity with SAP Hana Database as backend. With SAP Hana, Information views can be created and used for reporting and analysis purpose.
Read More
This document covers the concept of “Tooltips” in Power BI.Tooltips are the attractive features which allow us to add custom text to provide more detail for data points on a visualization.
Read MoreCopyright ©2019 Hybrid BI Solutions Ltd. All Rights Reserved