Publish report to Power BI Services
This document covers the concept of “How to publish the report to Power BI services from Power BI desktop”.
Read More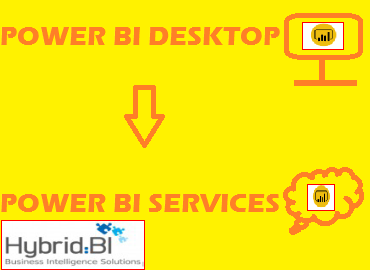
This document covers the concept of “How to publish the report to Power BI services from Power BI desktop”.
Read More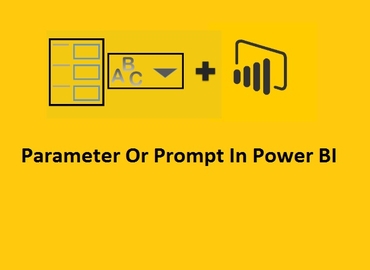
Parameter is the special kind of variable which argue to report or dashboard to shows resulting data related to passed input value.
Read More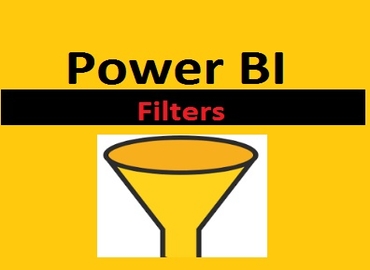
Filters are the kind of “restrictions” or “conditions” applied on the data of the report to restrict unwanted data and show only the data which is desirable.
Read More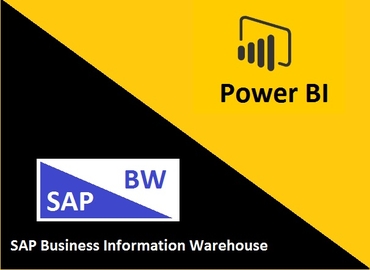
This article is going to focus on connectivity types between Power BI with SAP BW, limitations faced by customer.
Read More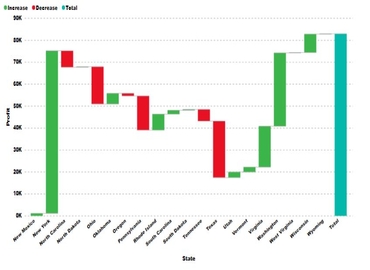
A waterfall chart is a form of data representation that helps in understanding the cumulative effect of sequentially arranged positive or negative values.
Read More
Quick Insight is a sixth sense of data in Power BI. It looks into our datasets and take the possible intuition out and display it.
Read More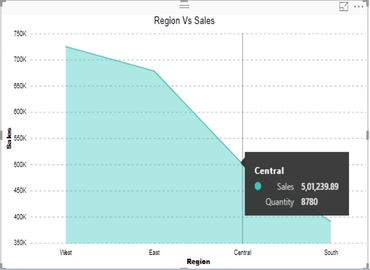
This document covers how to Area Chart in Power BI Service. This is high level document and assume resource has basic knowledge of Power BI Concepts.
Read More
Custom visuals are created by developers, using the custom visuals SDK, to enable business users to see their data in a way that fits the business best.
Read More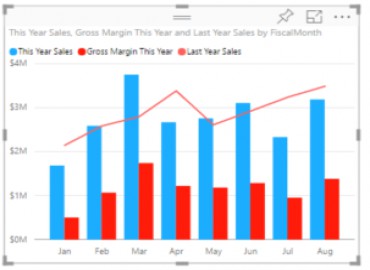
Power BI offer a single visualization that combines a line chart and a column chart. This combo chart will help us to make quickly comparison of data.
Read More
This document covers how to use TOP N dynamically in Power BI Service.
Read More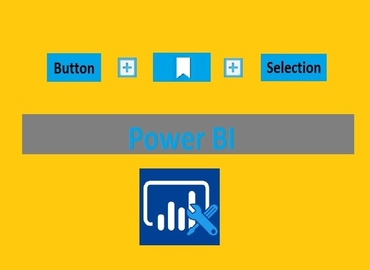
This document covers how to select components in Power BI by using “Buttons and Bookmarks”.
Read More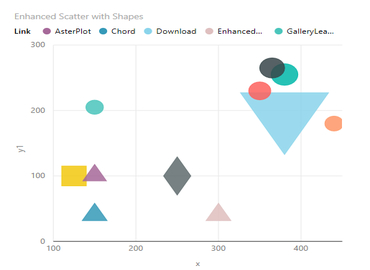
The scatter charts are used specially for the purpose showing that how one variable is affected by another.
Read More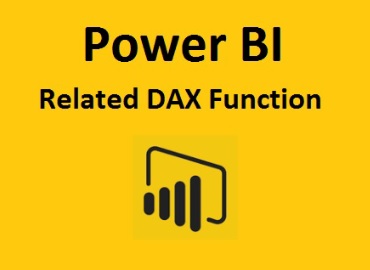
Related Dax function enables us to use the field values from one table to another table.
Read More.jpg)
Power BI Desktop provides capability to use Excel files stored in OneDrive for Business to create reports .
Read More
OneDrive for Business is an integral part of Office 365 and provides place in the cloud.
Read More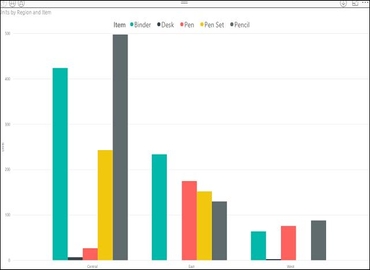
A clustered column chart is a form of data visualization that helps in understanding the comparison of multiple series.
Read More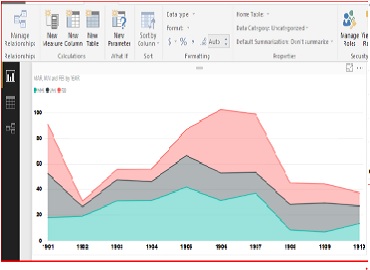
The data which is available on online websites called as web data. Power BI services provide functionality to access the same data.
Read More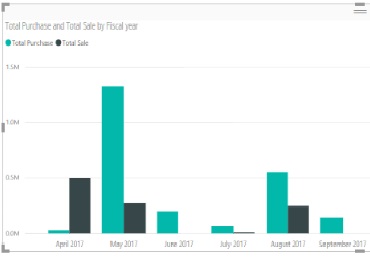
This is very basic requirement clients often have to display in charts / blocks. e.g. – Custom sort to display month wise trend for the fiscal year.
Read MoreCopyright ©2019 Hybrid BI Solutions Ltd. All Rights Reserved