Introduction to “Related” DAX function
Related is one of the function provided in Power BI. This function is very handy in Power BI. This enables us to use the field values from one table to another table.
Read More
Related is one of the function provided in Power BI. This function is very handy in Power BI. This enables us to use the field values from one table to another table.
Read More.jpg)
Users often have Excel workbooks stored on their OneDrive for Business.
Read More
OneDrive for Business is an integral part of Office 365 and provides place in the cloud where you can store, share, and sync your work files. You can update and share your files from any device with OneDrive for Business.
Read More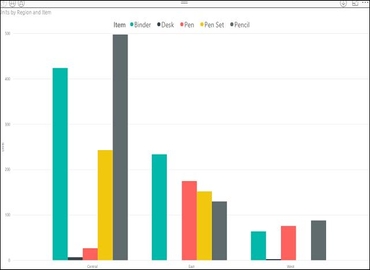
A clustered column chart is a form of data visualization that helps in understanding the comparison of multiple series.
Read More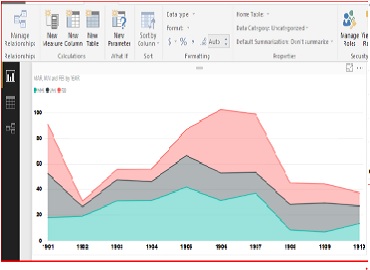
The data which is available on online websites called as web data. Power BI services provide functionality to access the same data.
Read More
The main idea is to write code easily, keep it lean and compact as much as possible. Let us discuss about some simple best-case scenarios of FOR expression.
Read More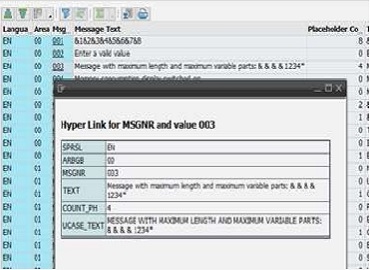
Hotspot or Hyperlink is a key functionality for any ALV, no matter which ALV type you use – SALV Model, SALV IDA or Classical ALV.
Read More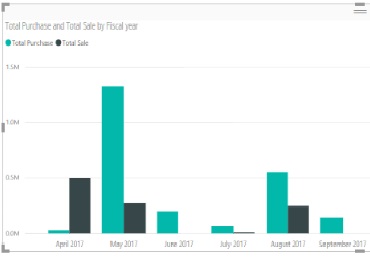
This is very basic requirement clients often have to display in charts / blocks. e.g. – Custom sort to display month wise trend for the fiscal year.
Read More
R is an open source programming language used in data analytics, machine learning and statistical computing.
Read More
This document covers the summarized information about Data Analysis Expressions (DAX) functions by providing list of different type of DAX functions used in Power BI Service.
Read More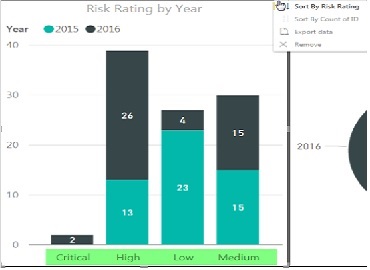
This document covers how to apply custom sort in Power BI Service. This is high level document and assume resource has basic knowledge of Power BI Concepts.
Read More
Responsive about adjustable screen resolutions and automatically resizable the dashboard, Image, web page etc. With more devices come varying screen resolutions, definitions and orientations.
Read More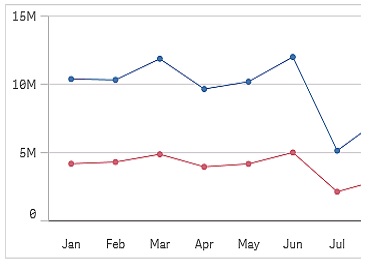
Your data set must consist of at least two data points to draw a line. A data set with a single value is displayed as a point.
Read MoreCopyright ©2019 Hybrid BI Solutions Ltd. All Rights Reserved